About Hourglass Trader
Data-driven option selling tools and a community built around consistent, compounding returns — not overnight gambles.
Who We Are
We are traders who leverage primarily option selling strategies to work towards our goal of consistently outperforming the market. While option selling is our primary strategy, we have a data-driven approach which is applicable to all types of traders.
Our goal isn't to 10x a portfolio in a year. The big risks necessary to achieve those unrealistic returns are risks that more often send an account towards zero. Instead, we understand that a patient approach which generates consistent, compounding gains is the best way to grow your wealth. If you believe there are no shortcuts in the market, then this is the place for you.
One thing we pride ourselves on is that this is not a strategy where you need to be glued to the screen, constantly nailing entries and exits. It's designed to minimize screen time so that you are free to focus on your job, classes, or just going outside and enjoying the day.
Data-Driven
Every tool is backed by real market data, updated automatically throughout the trading day.
Low Screen Time
Our strategies are designed so you don't have to watch charts all day. Set it and live your life.
Consistent Returns
We focus on high-probability, compounding gains over time rather than chasing home runs.
What We Offer
We believe that anyone who wants to learn how to sell options should be able to do so for free. Because of that, all educational content and videos are, and will always be, free. Our chatroom also features free channels where you're encouraged to ask as many questions as you'd like. We have a supportive community that understands there is no such thing as a stupid question.
For those ready to take it to the next level, we offer two premium tiers:
Discord Access
Join a community of like-minded traders where we all aim to win together.
- Live trade alerts
- Weekly gameplans
- 24/7 market discussion
- All premium research articles
Trading Tools
Proprietary scanners and dashboards that power our data-driven approach.
- 8 real-time trading tools
- Auto-updated during market hours
- Built-in filters, sliders, and sorting
- Everything in Discord Access, plus tools
Trading Tools
A closer look at each tool included with a Trading Tools subscription. All tools update automatically during market hours.
High RoR Put Scanner
Updated every 30 minScans the entire options market to surface put contracts with the highest return on risk (RoR). Each row shows the ticker, strike price, stock price, how far out of the money the contract is, and the bid/ask spread.
The Premium Score column balances RoR with distance out of the money. A high score means a contract offers strong returns and a comfortable safety cushion — not just one or the other. Use the RoR and Strike sliders to narrow results, and filter by expiry date.
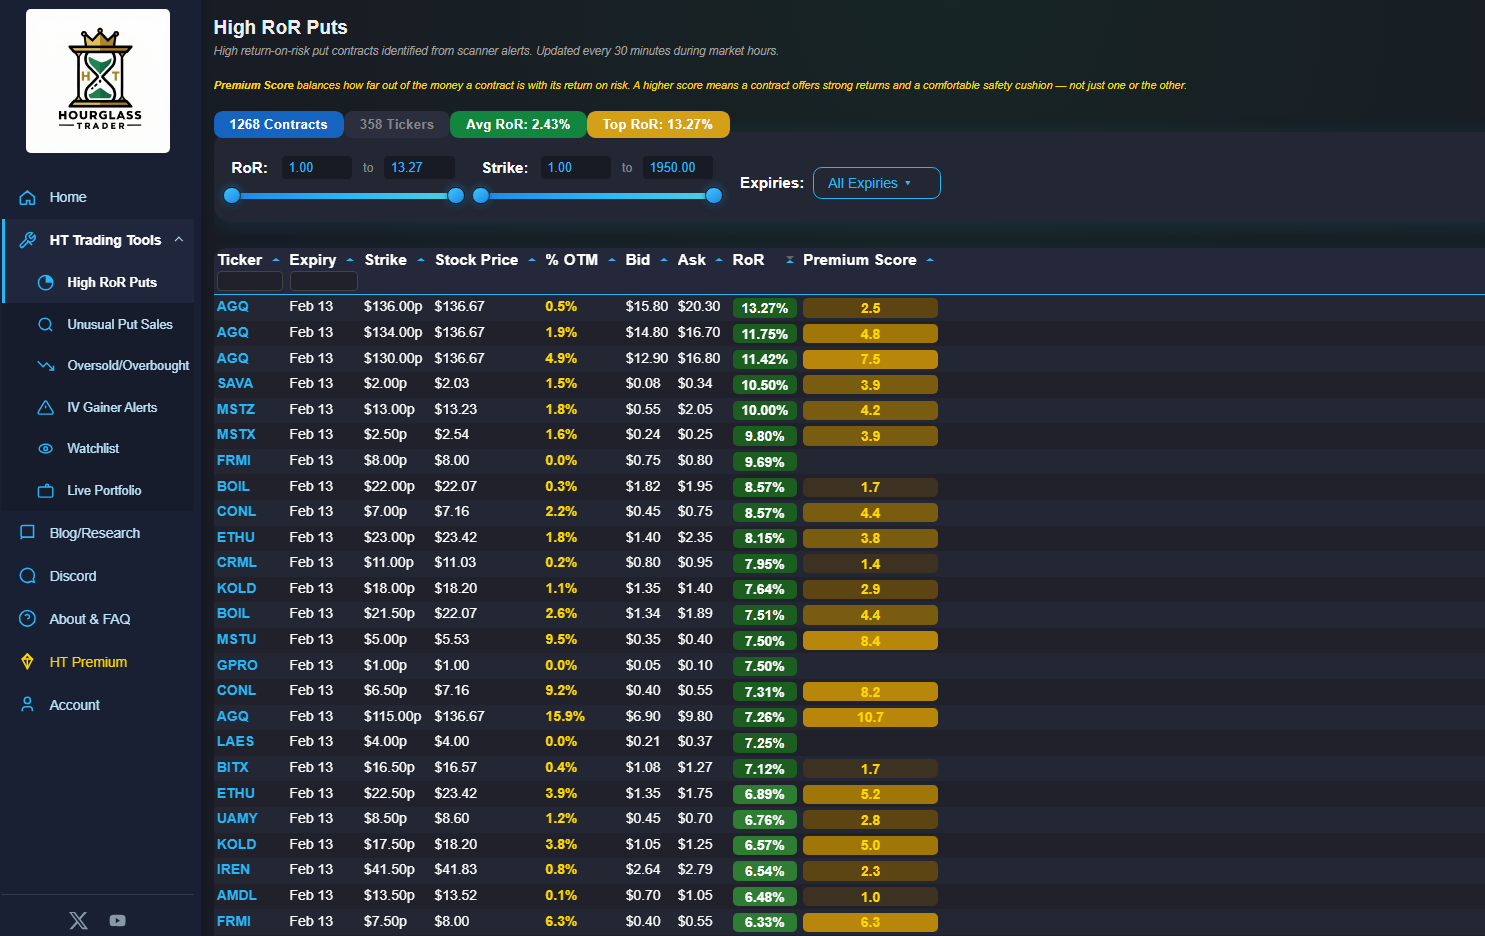
Tip: While this scanner returns put options, stocks with high put premiums also have high call premiums — making this scanner useful for both sides of the trade.
Unusual Put Sale Scanner
Updated every 30 minOne of our favorites. This scanner flags large, unusual opening put sales so you can follow institutional money. When big players sell puts aggressively, it often signals conviction that a stock will hold or rise. The Notional column shows the dollar size of each trade so you can see exactly how much capital is behind it.
Key columns to watch:
- At/Below Bid: The trade was executed at or below the bid price — very aggressive and bullish. These are the ones to pay closest attention to.
- Spread: If this is checked and nothing else, the trade is part of a spread and should not be viewed as a standalone opening put sale.
- Roll: Indicates the trader is rolling an existing position to a new expiry or strike — still a bullish signal that they want to maintain the position.
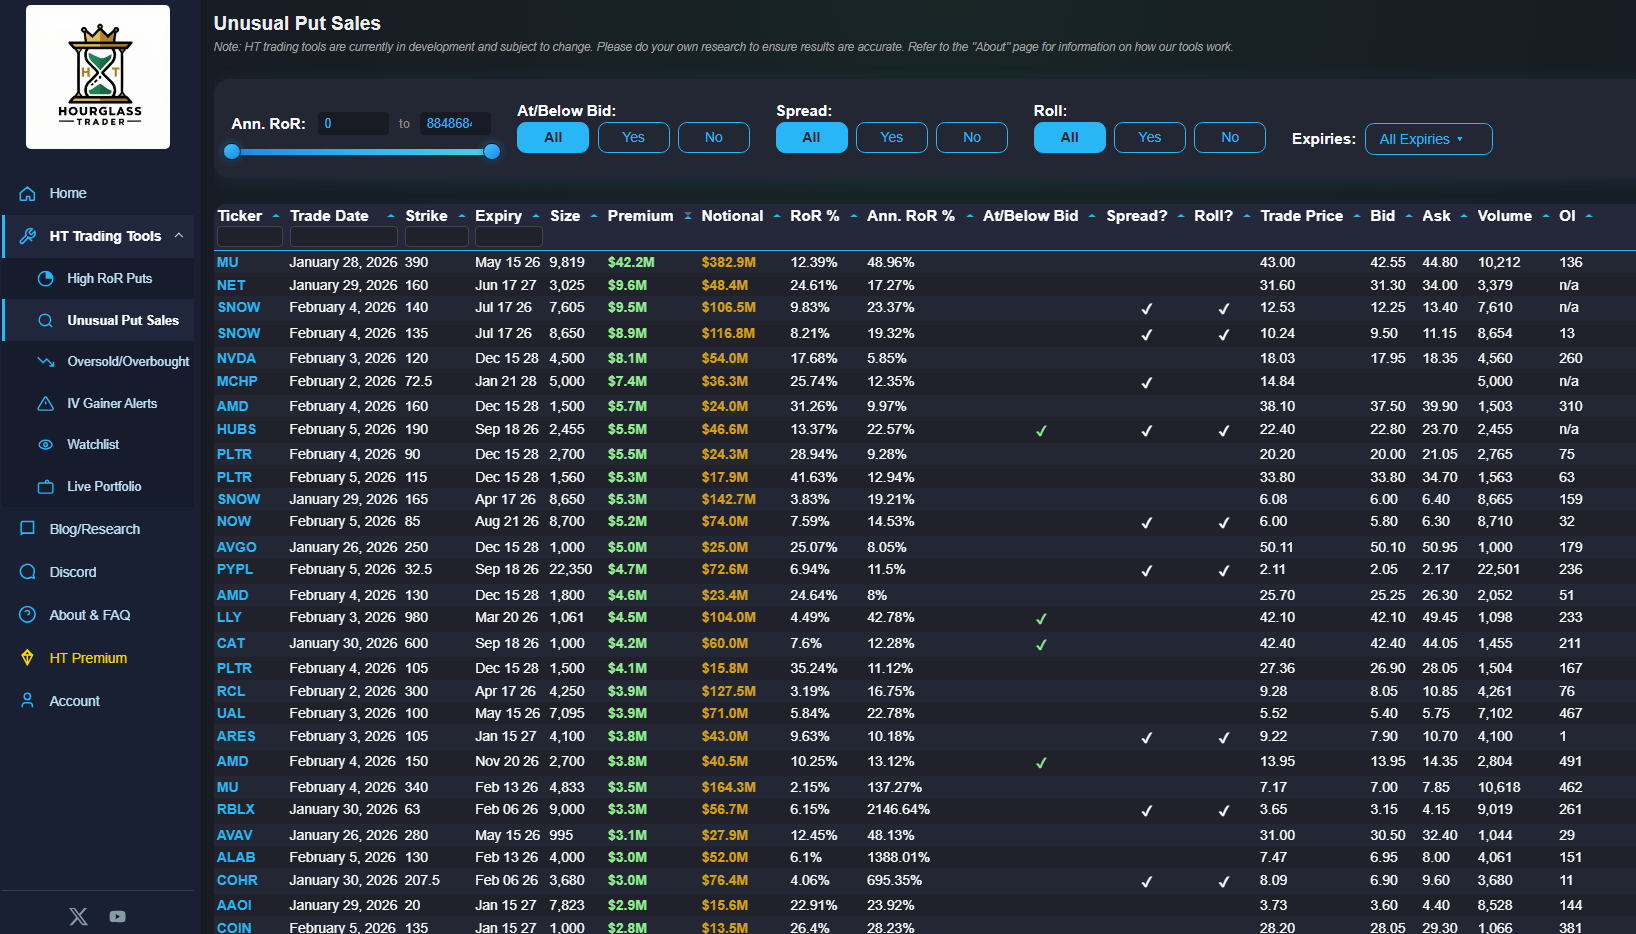
In short: Filter for "At/Below Bid = Yes" and "Spread = No" to find the highest-conviction opening put sales from institutional traders.
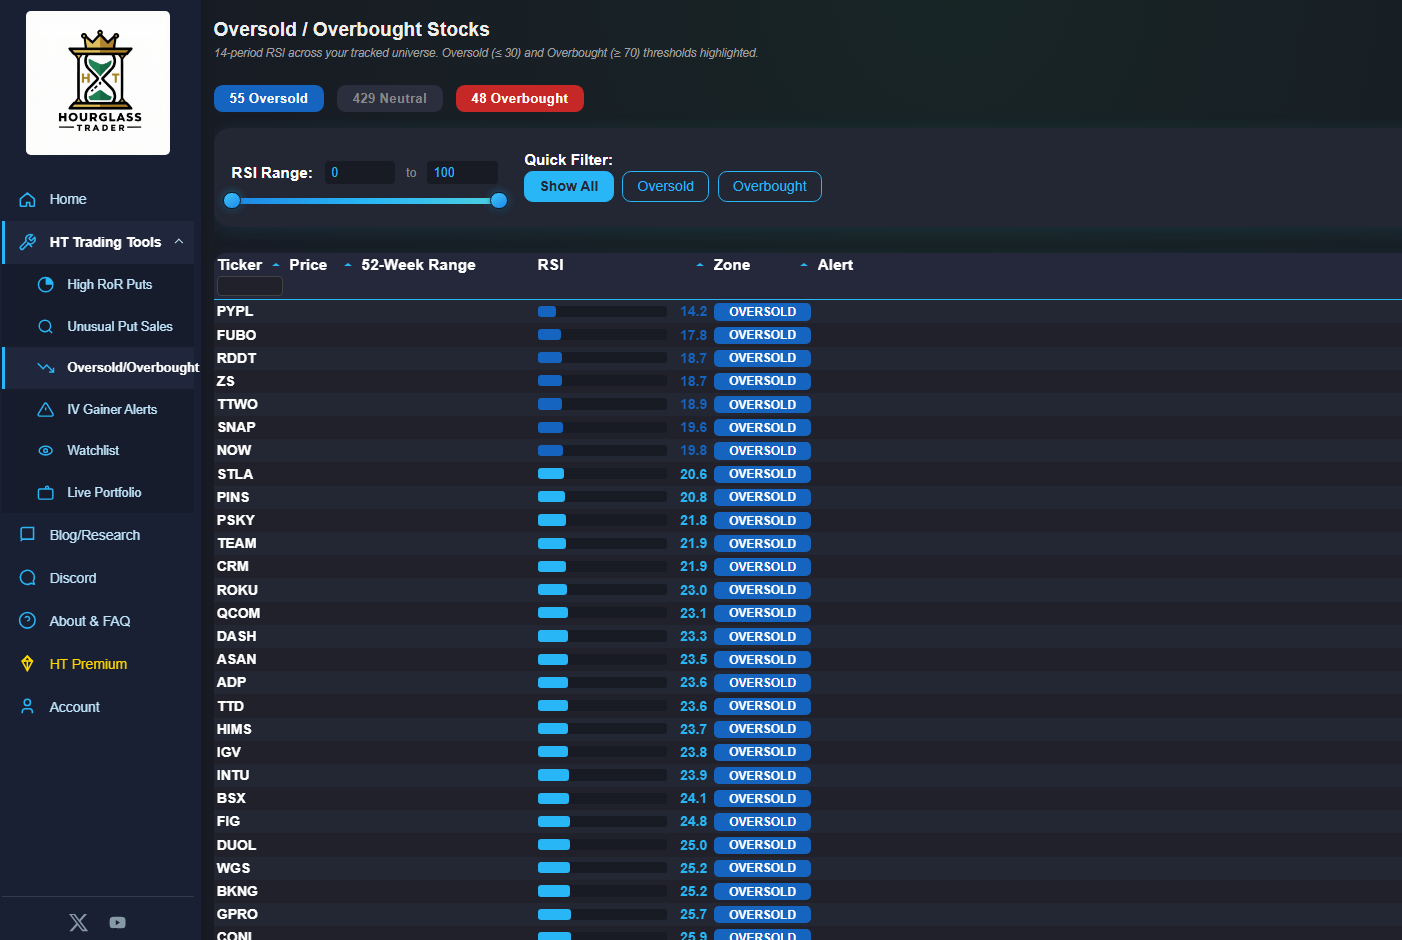
Oversold / Overbought Scanner
Updated every 30 minCalculates the 14-period RSI for every stock in our tracked universe and surfaces oversold (RSI ≤ 30) and overbought (RSI ≥ 70) opportunities. Each stock also shows its current price and where it sits within its 52-week range.
The Alert column flags particularly interesting setups: stocks that are oversold and near their 52-week low, or overbought and near their 52-week high. These are the tickers approaching potential inflection points worth watching closely.
Use the RSI slider or quick-filter buttons to isolate exactly the zone you're interested in.
IV Reversion Scanner
Updated every 5 minDetects sudden intraday price spikes using custom scripts running on 5-minute candles. A stock triggers when it moves 3%+ on a single candle with a volume surge and rising implied volatility — confirming the spike is real and IV is elevated.
When IV spikes temporarily, option premiums become inflated. This creates an opportunity to sell options at elevated prices and profit when volatility reverts to normal. The scanner catches these events as they happen during market hours.
Strategy: For more on how we use IV reversion to generate high-probability trades, check out the IV reversion video on our YouTube channel.
Top Movers
Updated every 5 minSurfaces the day's biggest gainers and losers among optionable stocks. Filters to only show stocks above $5 with meaningful volume (≥ 500K shares), then verifies each candidate actually has active options contracts before including it.
Use the Gainers / Losers toggle to isolate one side of the market. The Change % and Change $ columns show the day-over-day move from the previous close, while Volume helps you gauge how much conviction is behind the move.
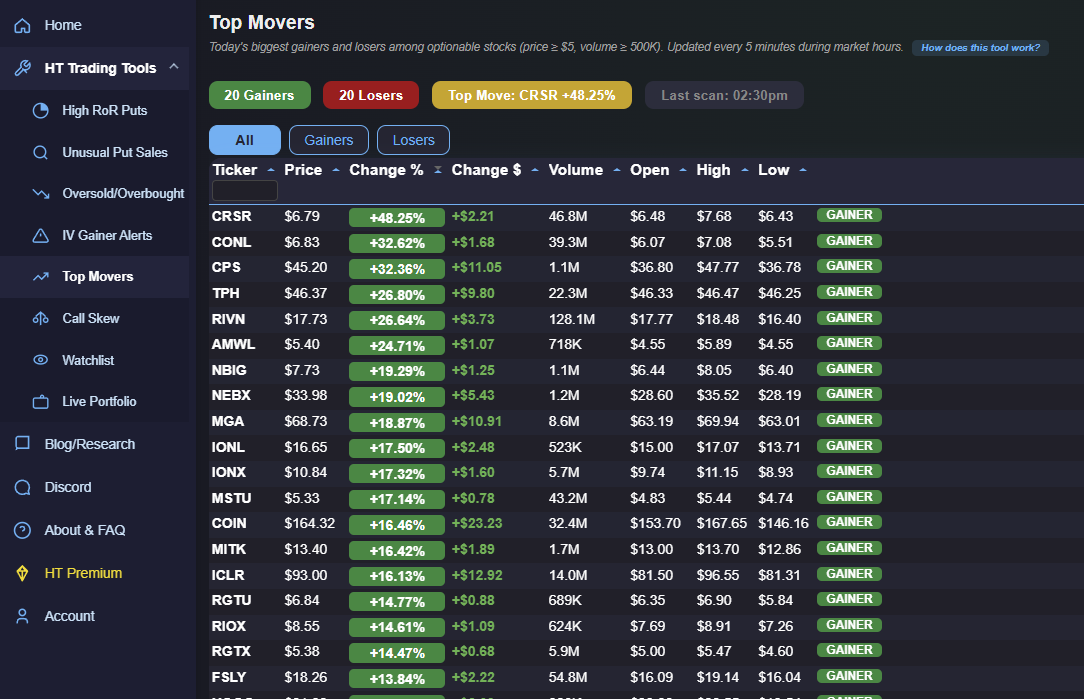
Tip: Big movers with options are prime candidates for selling elevated premium. Cross-reference with the IV Reversion Scanner tool to find movers where implied volatility has also spiked.
Call Skew Scanner
Scans twice dailyScans over 3,000 optionable stocks to find where OTM call options are priced significantly higher than OTM puts at similar distances from the money. Unlike simple IV comparisons, this scanner uses a distance-adjusted price skew methodology — it compares actual option midpoint prices and accounts for the fact that a call priced higher than a put at a further distance from the money is an even stronger signal.
The Price Skew column shows the adjusted ratio — a value of 1.50x means OTM calls are 50% more expensive than equidistant OTM puts. The Top Pair column shows the specific call and put strike that exhibited the greatest skew, along with their midpoint prices, so you can verify the signal directly.
High call skew often reflects institutional demand for upside exposure, anticipated catalysts, or short squeeze dynamics. The scanner filters for liquid options only (tight spreads, real open interest, midpoints above $0.25) and excludes non-standard adjusted contracts from splits or special dividends.
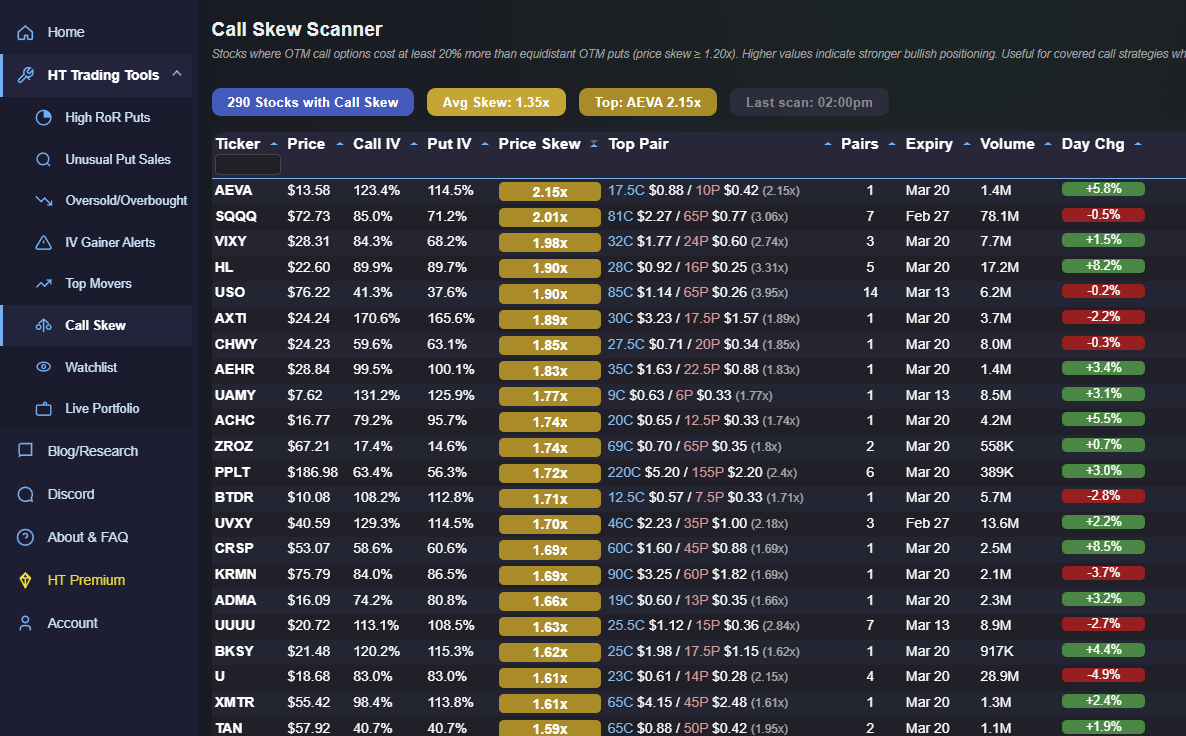
Strategy: Stocks with elevated call skew present opportunities for covered call strategies where you sell overpriced calls and hedge with cheaper puts. You can also construct credit spreads on the call side where premium is richest.
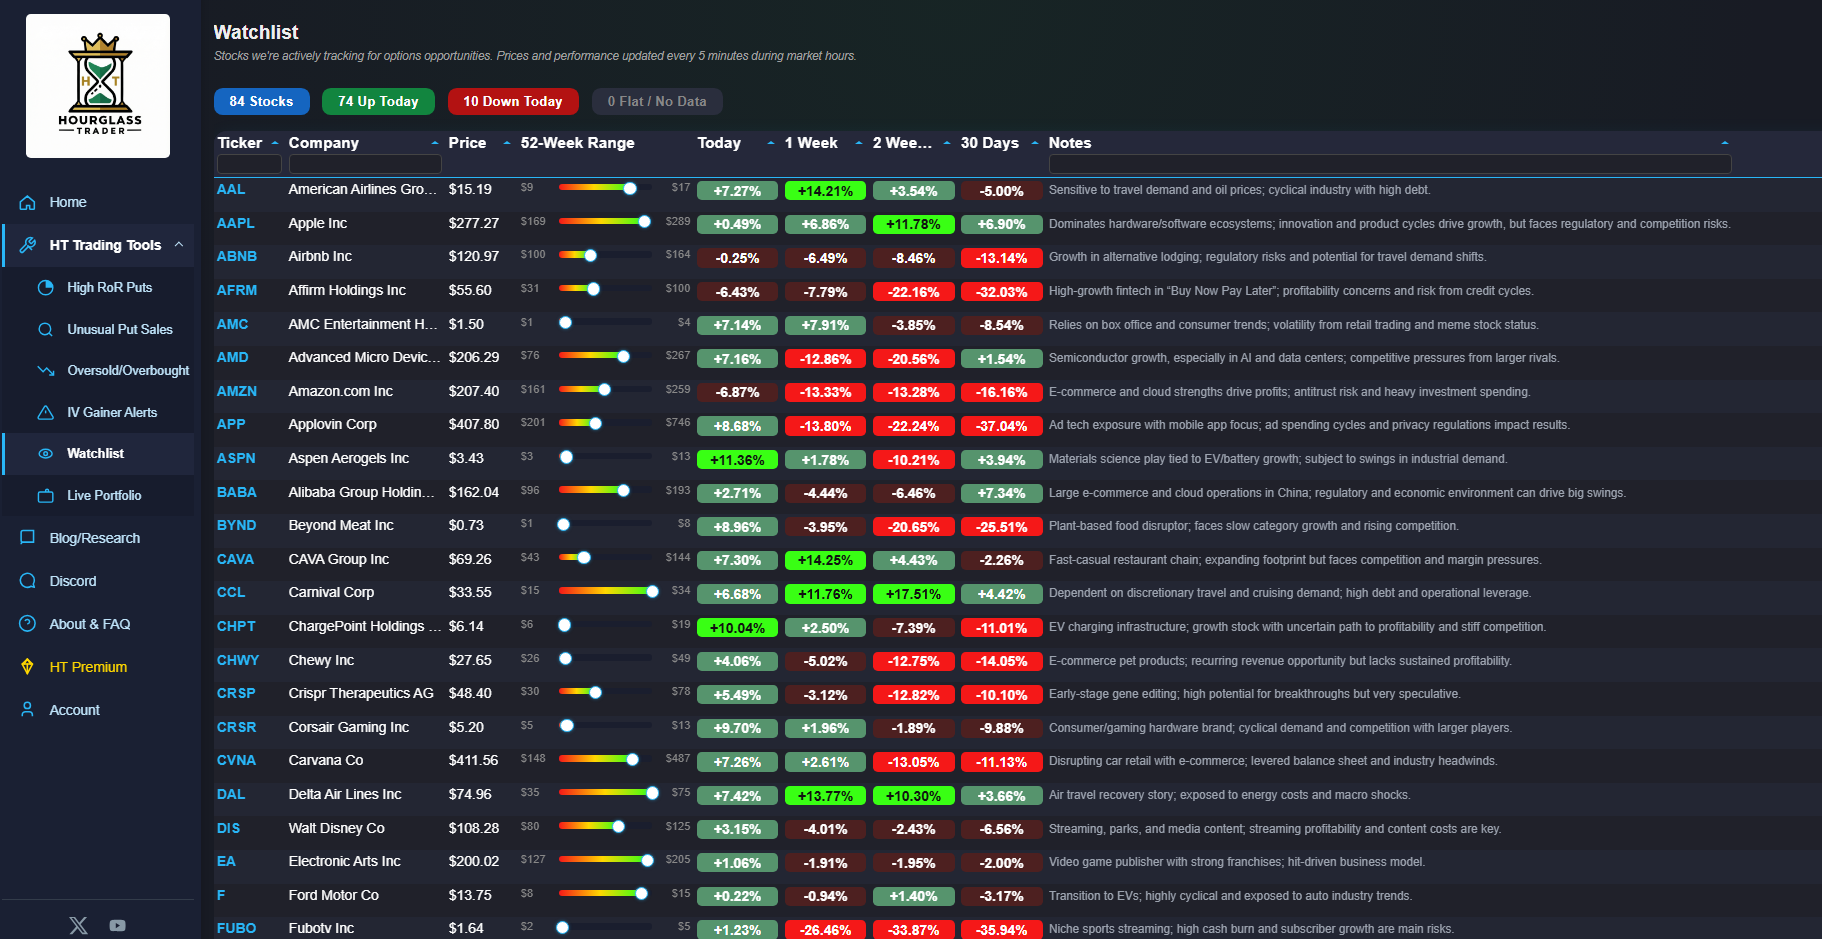
Watchlist
Updated every 5 minA live dashboard of stocks we're actively tracking for options opportunities. Each stock shows its current price, 52-week range (with a visual bar showing where price sits today), and performance across multiple timeframes: today, 1 week, 2 weeks, and 30 days.
The Notes column includes a brief thesis for why each stock is on our radar — useful context when deciding whether an opportunity aligns with your own research.
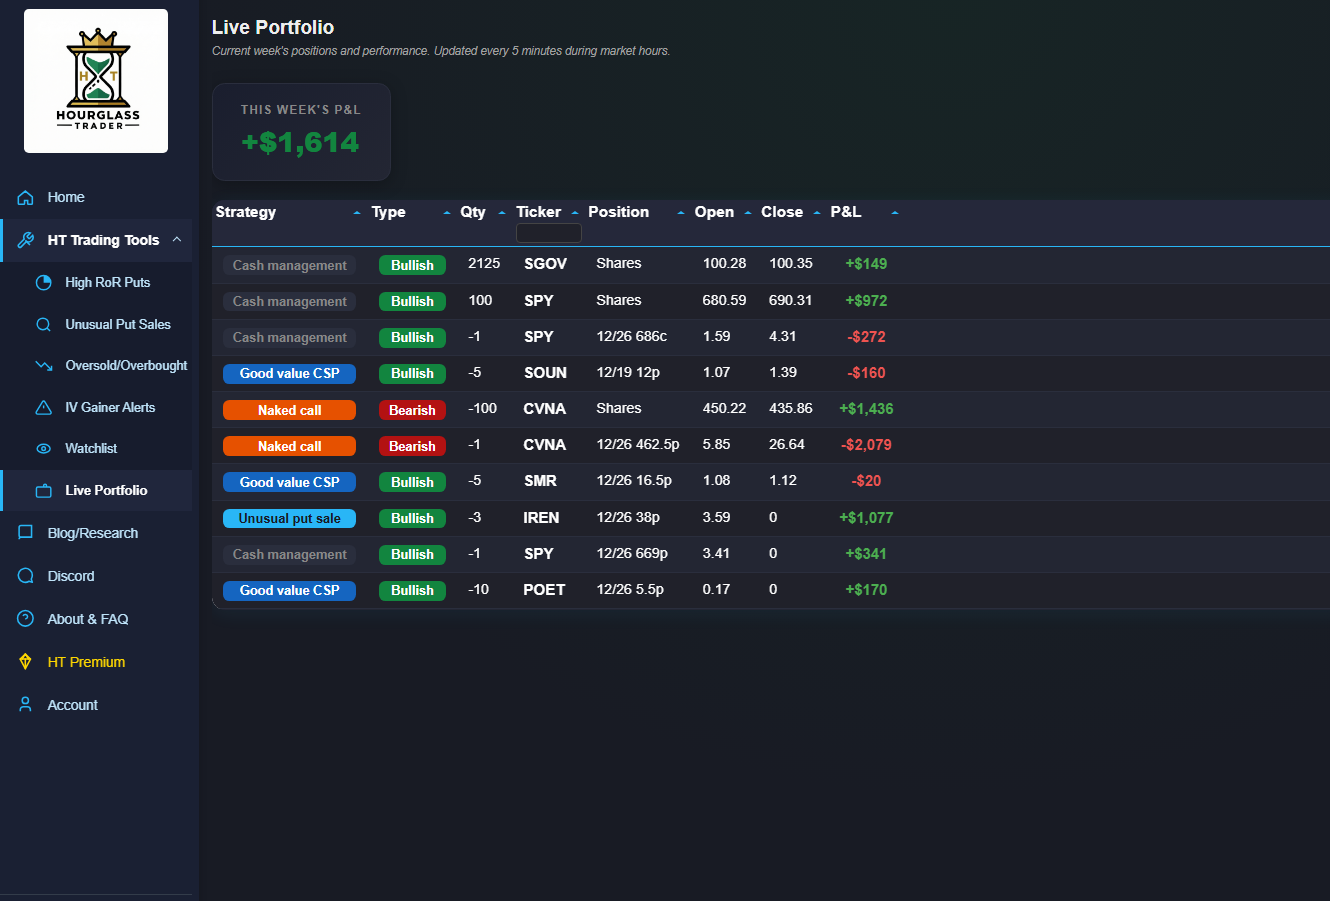
Live Portfolio
Updated every 5 minSee exactly what we're trading in real time. The Live Portfolio shows every open position, the strategy behind it, direction (bullish/bearish), entry price, current price, and live P&L. A banner at the top displays the week's total profit or loss.
While our tools can surface a lot of great data, there are no trades we're more confident in than the ones where we put our own money on the line. This is the most transparent way to see how we're executing our strategies.
Frequently Asked Questions
Quick answers to common questions about Hourglass Trader.
Hourglass Trader is an options-focused trading platform that combines proprietary scanning tools, educational content, and a community of like-minded traders. Our focus is on option selling strategies that generate consistent, compounding returns.
Yes. All educational videos, written guides, and blog content are completely free and always will be. Our Discord also has free channels where you can ask questions and learn from the community. Premium tiers unlock the trading tools and additional Discord channels.
Discord Access gives you full access to our premium Discord channels including live trade alerts, weekly gameplans, market discussion, and all premium research articles.
Trading Tools includes everything in Discord Access plus full access to all eight proprietary trading tools on this website (High RoR Puts, Unusual Put Sales, Oversold/Overbought, IV Reversion Scanner, Top Movers, Call Skew Scanner, Watchlist, and Live Portfolio).
It depends on the tool. The IV Reversion Scanner, Top Movers, Watchlist, and Live Portfolio update every 5 minutes during market hours (9:30 AM – 4:00 PM ET). The High RoR Puts, Unusual Put Sales, and Oversold/Overbought scanners update every 30 minutes. The Call Skew Scanner runs twice daily (10:30 AM and 2:00 PM ET) due to the depth of its full-market scan. All tools pull live market data automatically.
Not at all. Our free educational content is designed to take you from beginner to comfortable with option selling fundamentals. The tools are built to be intuitive, and our Discord community is always happy to help answer questions. Everyone starts somewhere.
No. The Live Portfolio is meant to provide transparency into how we're executing our strategies, not as a list of trades to blindly follow. Your account size, risk tolerance, and goals are different from ours. Always do your own research and make sure any trade fits your personal situation.
Log in and visit your Account page. You can cancel anytime with one click. If you run into any issues, shoot us an email and we'll take care of it.
Monthly and lifetime products: All sales are final.
Annual renewals: If your subscription auto-renews and you intended to cancel, contact us within 14 days of the renewal date to receive a full refund.
Important Disclaimer
We are not financial advisors. The information provided is for educational purposes only and should not be considered financial advice. Always do your own research and consult with a licensed professional before making investment decisions.